Home
Research
Publication
Teaching
CV
Personal

Project artifacts - Database Administrator
From 1996 until 2002, I served as a database administrator at several companies including two banks in Korea as a junior level for five years, and IBM e-Business Hosting team (IDC) as a senior level for two years. During that time, I was responsible for all aspects of database administration: design, implementation, and maintenance of the database infrastructure for the banking systems and hosted servers. After seven-years of industry experience, I decided to join the University of Texas at Arlington to pursue a doctorate degree in computer science, particularly in the areas of databases and multimedia. The reason I moved from industry to academia was that I needed to balance of practical skills in DBMS and strong academic background in databases. After four years of research experience in the area of databases, I am about to return to the proper position where both my industrial and academic backgrounds are needed
In this statement, to demonstrate my qualifications and abilities I introduce my belief of a database administrator, and artifacts of database projects I completed successfully as a database administrator.
My belief of a Database Administrator
Throughout my life in the industry, I established my belief of a database administrator that I keep in mind wherever I work. My belief is built around five items: 1) user oriented management, 2) harmony of practicality and theory, 3) broad knowledge of IT and computer science, 4) self-motivation and implementation, and 5) documentation.
- User oriented management: I believe that a level of a database
administrator is determined by the satisfaction of database users.
In order to bring the best satisfaction, the administrative
jobs, such as design, implementation, and maintenance, should be
driven by the user requirements.
- Harmony of practicality and theory:
A database administrator needs to harmonize the practical and
theoretical approaches to database managements.
Without theory, my knowledge of databases cannot be
strengthened and extended to other problems.
Without practicality, the knowledge cannot avoid pure
scholasticism. When I conduct administrative jobs, I harmonize these
aspects..
- Broad knowledge of IT and computer science:
Due to the nature of DBMS, i.e., a complex system that integrates
various IT technologies and algorithms, a database administrator
should be all-round player including hardware, software, middle ware,
network, data structure, database algorithms, and data contents
managed by DBMS.
- Self-motivation and implementation:
I continue pursuit for increased knowledge of new technologies.
Moreover, I try to apply them to real systems to improve user
satisfactions and system performances.
Such an enthusiasm is reflected on the implementation.
- Documentation: Unlike a developer who implements software and a researcher who develops and publishes the algorithms, a database administrator should finalize his/her jobs by documentation. The documents may include histories, configurations, and processes of any administrative jobs as well as publications with a researcher.
Artifact
A:
Roles of Database Administrator
Artifact B: Management of Documents
Artifact C: TPI (Total Performance Index) for DBMS tuning
Artifact D: SDM (Server and Database Monitoring) ToolArtifact
A
Roles of Database Administrator
In 2001, I joined IBM e-Business Hosting team as a senior database administrator. IBM e-Business Hosting offers a unique hosting environment for IT infrastructure, called Universal Server Farm (USF), which includes facility, network, server, application, and DBMS. It also covers detailed monitoring, capacity planning and data modeling services. However, the scope of database administrator’s job was not defined clearly, which caused some confusion of responsibilities in the team. As soon as I joined the team, the first job that I completed was to define the roles and scopes of a database administrator. Throughout working at IBM, I performed database administrative jobs based on this document.
The roles of a database administrator are defined based on the following criteria:
-
Requirements of customer, database application developer, and end-user.
-
Capacity of s database administrator.
-
IT infrastructures: facility, network configuration, operating system, and DBMS.
Main Categories of DBA Roles
First, I determined seven main categories of DBA
roles based on the above criteria as followings:
-
Management Service is the main service for customer. This service consists of many skillful jobs to maintain DBMS as a normal state. Installation and all kinds of management jobs are good examples of this service.
-
Monitoring Service is a watching service to be aware of abnormal state beforehand. In the case of abnormal state, a database administrator notifies the situation to customer with proper actions. Monitoring services should be performed automatically and properly, sometimes with operators.
-
Networking & Security Service is the service for keeping secure DBMS on any IT environments including Internet and Intranet. DBMS Security policies should be based on the business rules. This service supports a configuration of network environment related to DBMS.
-
Backup & Recovery Service is more important service than any other DBA jobs. DBA should backup database to be able to meet any kind of failure or disaster. In the case of the failure or disaster, an administrator should recognize it and recover database as soon as possible.
-
Tuning Service is the service to keep DBMS best state. This needs a DBA with supreme skills and enough experiences. A scope of the service ranges from server tuning to application tuning. If necessary, an administrator serves project-based service to tune and re-engineer system totally.
-
Technical Service is the special service for a customer who needs special skills of DBA, and wants DBA help regularly.
-
Training Service is an optional service for upgrading of customer’s skills. Generally, the service will be provided on-site, such as a lecture style, as well as off-site, such as mailing service.
List of DBA Job for each Category
Next, I listed up all the detailed jobs in each main category. The information of detailed job contain title, level, period, time and remarks. Each job is classified into three levels, i.e., Basic, Intermediate and Advanced, based on the importance and workload. The period means how often the job is performed, such as daily (D), weekly (W), quarterly (Q), and Yearly/Temporary (Y). The time indicates workloads of the job. The level and time can be used for the evaluation of DBA.
Table 1 and 2 are the sample lists of DBA jobs for a monitoring service, and a backup and recovery service, respectively.
Table 1. DBA Jobs list for Monitoring Service
|
Title |
Level |
Period |
Time |
Remark |
||
|
Basic |
Intermediate |
Advanced |
||||
|
Monitor Rollback Segment |
X |
|
|
1/d |
0.2h |
Oracle Only |
|
Monitor Space |
X |
|
|
1/d |
0.1h |
|
|
Monitor Lock/Wait |
|
X |
|
1/d |
0.2h |
|
|
Monitor Processes |
|
X |
|
1/d |
0.2h |
|
|
Monitor Database Objects |
X |
|
|
1/d |
0.1h |
|
|
Check Application Program |
|
X |
|
1/d |
0.1h |
|
|
Check Database Up |
X |
|
|
1/d |
0.1h |
With alert service |
|
Daily Check procedure/Report |
|
|
X |
1/d |
0.1h |
|
|
Weekly Check procedure/Report |
|
X |
|
1/w |
0.2h |
|
|
Monthly Check procedure/Report |
|
X |
|
1/m |
1h |
|
|
Alarm Service |
|
X |
|
1/d |
0.1h |
|
|
Database Monitoring Script |
|
|
X |
1/m |
0.5h |
|
|
Monitor OS Resource |
|
|
X |
1/d |
0.1h |
|
|
Check Log New Entry |
|
X |
|
1/d |
0.1h |
|
|
Monitor OPS |
|
|
X |
1/d |
0.5h |
Oracle Only |
Table 2. DBA Jobs list for Backup and Recovery Service
|
Title |
Level |
Period |
Time |
Remark |
||
|
Basic |
Intermediate |
Advanced |
||||
|
Defining Backup/Recovery Strategy |
|
X |
|
1/y |
10h |
|
|
Building and testing Backup/Recovery Scenario |
|
|
X |
1/q |
6h |
|
|
Configuring Backup environment |
|
X |
|
1/q |
2h |
|
|
Data Export/Import |
X |
|
|
1/d |
0.5h |
|
|
Backup using RMAN |
|
|
X |
1/d |
2h |
Oracle Only, Using TSM |
|
Backup using OS |
|
|
X |
1/d |
2h |
Using TSM |
|
Critical data Backup |
|
X |
|
1/d |
0.5h |
|
|
Manage Archive Log |
|
X |
|
1/y |
0.2h |
|
|
Recovery (requested by Customer) |
|
|
X |
1/y |
6h |
|
|
Off-site Storage |
|
|
X |
1/d |
0.5h |
|
The
full description of roles of database administrator is available on the
following web site:
Artifact B
Management of Documents
From 1996 until 1999, I worked as a junior database
administrator in Information and Technology department at a bank in Korea.
On the first day of attending my office, my manger gave me a simple
question: “Do you think what is the most important job as an
administrator?” Then, his
answer was very simple, too. It
was “Documentation”. Throughout
my seven years experience of a database administrator, I believe that 51%
of DBA jobs are for documenting, while 49% of them are for the other.
The final output of DBA activities is neither recovered systems nor
enhanced SQL statements, but a document where an administrator logged
entire history and processes about how to recover a damaged system and how
to tune up SQL statements. After I became a database administrator, I have created
various documents about database managements, and maintained them
periodically. These documents
always help me to manage and diagnose systems and databases properly.
In addition, these histories provide a clue and cause of system
problems when they occur.
List of the
Managed Documents
I introduce 4 selected documents that I created and
managed as a database administrator.
The entire documents are available on my personal DBA web site:
http://www.bridgeport.edu/~jelee/dba/dba.html.
1.
System Configuration for IT Infrastructure
-
Purpose: The system configuration is the master document describing an overview of IT infrastructure. It should be updated whenever the configuration is changed.
-
Contents: Overview of IT configuration, Unix server configuration, Network configuration, Database configuration, Disk box configuration, Middle ware configuration, Backup configuration, Layout of server floor, and Detailed configuration of each project.
Figure 1. Sample slides of System Configuration for IT Infrastructure
2.
Current State of IT assets
- Purpose: This document manages current state of IT assets including
server, disk, DBMS, printer, and tapes.
It should be updated whenever the assets are changed.
- Contents: Classification, Model name, Project name, Service, CPU, Memory,
Disk size, Manufacture name, Provider, OS, DBMS, Location, Contract
information (contractor, date, price, license), Maintenance, IP
address, and hostname.
- URL: http://www.bridgeport.edu/~jelee/dba/ITAsset.pdf
Table 3.
Sample of Current State of IT assets
|
|
Model |
Project |
Service |
EA |
CPU |
Memory |
Disk |
Vender |
O/S
|
DBMS |
Loca-tion |
Host |
|
Svr |
RELIANT RM1000 |
SIS |
Data Warehousing |
1 |
250MHz*42 |
512Mb*32 |
1452 |
Siemens |
Reliant 5.43 C20 |
Informix 8.21 |
4th
F |
|
|
Svr |
RELIANT RM600 |
SIS |
ODS,STOCK |
1 |
250MHz*8 |
4Gb |
18 |
Siemens |
Reliant 5.43 C20 |
Oracle 8.0.5 |
4th
F |
sis-4 |
|
Disk |
EMC 3700 |
SIS |
OCR, Foreign |
1 |
|
Cache
4Gb |
1620 |
EMC |
|
|
4th
F |
|
|
|
|
|
|
|
|
|
|
|
|
|
|
|
3.
DBMS Configuration
-
Purpose: A DBMS configuration contains all the information about DBMS managed by a database administrator. It should be updated whenever the configuration is changed.
-
Contents: Identification number, Project name, Model name, Hostname with IP address, CPU, Memory, Disk, OS, and DBMS Information (vender, version, DB name, options, raw device, allocated memory, allocated disk size, remarks)
Table 4. Sample of DBMS Configuration
|
System |
Model
name |
OS |
RDBMS |
DB |
Option |
DISK |
Mem |
License |
DB |
Back |
Admin |
|
SIS DW Svr. |
RM1000(MPP) |
Reliant UNIX 5.43 |
Informix 8.21.UD4X1 |
dbacq,
dbciw, dbolp |
1280G |
420M |
50
Users |
Table |
O |
informix |
|
|
SIS AP Svr. |
Sun Enterprise450X2 |
SUN OS 5.7 Generic |
Oracle 8.0.6.0 |
|
|
|
|
|
|
|
oracle |
|
Internet Bank |
Sun Enterprise 4500 |
SUN OS 5.6 Generic |
Oracle 8.0.6.0 |
DBIBNK1 |
OPS, Partition |
|
1.7G |
32
Users |
Archive |
O |
oracle |
|
|
|
|
|
|
|
|
|
|
|
|
|
4.
Analysis of Table Access
-
Purpose: This document includes the access information of tables to analyze access patterns of DBMS. This is used for database modeling, database sizing, building indexing, disk fragmentation, and maintenance. It is updated every month during the monthly maintenance.
-
Contents: Project name, Owner name, Table name, Number of daily access (read/write), Sizing (type, number of rows, average row length, estimated size), and Table properties (cache, partition, index, comment)
Table 5. Sample of Analysis of Table Access
|
Service |
Table
Name |
Number
of Daily Access |
Sizing |
Table
Properties |
||||||||
|
Read |
Write Access |
Keep |
Estimated |
Avg
Row |
Estimated |
Cache |
Partition |
Index |
||||
|
Select |
Insert |
Update |
Delete |
Count |
||||||||
|
Common |
AEBS_IB_BANK |
3 |
0 |
0 |
0 |
Daily |
50 |
10 |
0.0
|
|
|
1 |
|
Common |
AEBS_IB_JOB |
3 |
0 |
0 |
0 |
Weekly |
20 |
30 |
0.0
|
|
|
1 |
|
Common |
AEBS_IB_GAMOKPRP |
4 |
0 |
0 |
0 |
Permanent |
50 |
3 |
0.0
|
Y |
|
1 |
|
|
|
0:Rare
~ 4:Frequent (transactions) |
|
|
|
|
|
|
||||
5.
Other Documents
-
Naming rules for database objects, such as table, index, procedure, and instance.
-
Backup and Recovery Procedures
-
Disk Configuration
-
Database Network Environment
-
Database Security Policy
(The above documents are available upon request. Please, email to jelee@bridgeport.edu )
Artifact
C TPI (Total Performance
Index) for DBMS tuning
Database
users complain a performance of system like “Database is very slow. My
program is not running.” They
do not say that “My program cannot access database memory. Please,
increase the size of memory.” Thus,
DBA should be ready to answer any
requests by tuning it up. However,
database tuning is not easy task for an administrator since it is
necessary to check all the aspects of the system including CPU, memory,
disk I/O, and operating system. In
order to keep DBMS best state, I developed a diagnostic tool for DBMS,
called Total Performance Index (TPI) using Microsoft Excel and shell
scripts.
TPI checks four categories to evaluate the DBMS, such as memory, disk, educational level of DBA, and system. The detailed items of each category are evaluated by several shell scripts. A perfect score of each category is 250, and the final score of TPI is automatically computed on a maximum scale of 1,000 points. Based on the final score, the DBMS is graded in A to F levels; A is the top 10 percent of most DBMS, and F indicates the bottom 30 percent of most DBMS. In addition, an administrator can use the diagnostic tool to find the weak points to be solved.
Memory Performance Index (MPI)
MPI indicates the status of memory utilization in a
database system. The overall
performance of DBMS totally depends on its memory utilization.
In general, it is expected that well-managed DBMS allow a query to
access over 98 percent of data from memory.
If the percentage is below 90, it should be tuned up for better
performance. The MPI score is
computed by considering 9 items. A
shell script automatically investigates the information of each item.
Table 6 shows a MPI score of a sample DBMS.
It indicates that the overall memory performance is very poor that
is caused by some harmful SQL.
Table 6. Memory Performance Index (MPI) for a sample DBMS
|
Category Index |
|
|
|
Level
Required |
|
Maximum |
Score |
||
|
Buffer hit ratio |
|
|
|
> 98 percent |
|
30 |
|
10 |
|
|
Dictionary hit ratio |
|
|
|
> 98 percent |
|
30 |
|
30 |
|
|
Library hit ratio |
|
|
|
> 98 percent |
|
30 |
|
30 |
|
|
Sorts in memory |
|
|
|
> 98 percent |
|
30 |
|
30 |
|
|
Buffers in x$bh at state=0 |
|
|
10-25 percent |
|
30 |
|
0 |
||
|
Shared pool buffers continuous |
|
10-25 percent |
|
30 |
|
30 |
|||
|
Top 10 statements memory use |
|
< 5 percent |
|
30 |
|
0 |
|||
|
Top 25(worst memory) statements tuned |
Yes |
|
|
30 |
|
10 |
|||
|
Pin/cache frequently used objects |
|
Yes |
|
|
10 |
|
0 |
||
|
Memory Performance Index (MPI) |
|
Section Total |
|
250 |
|
140 |
|||
Disk Performance Index (DPI)
DPI shows a disk performance accessed by a database
system. To keep the best
state of disk performance, there are several rules to be considered when
an administrator configures it; separation of table and index spaces,
partition of table, and distribution of redo/undo/temporary data.
The DPI score is a sum of scores from 9 items. In Table 7, we can realize that there are many fragmented
tables that should be reorganized for better performance.
Table 7. Disk Performance Index (DPI) for a sample DBMS
|
Category Index |
|
|
|
Level
Required |
|
Maximum Score |
|||
|
Top 25(worst disk) statements tuned |
|
Yes |
|
|
30 |
|
10 |
||
|
Top 10 statements disk use |
|
|
< 5 percent |
|
30 |
|
0 |
||
|
Tables/indexes collocated |
|
|
No |
|
|
30 |
|
30 |
|
|
Mission-critical tables with chaining |
|
No |
|
|
30 |
|
10 |
||
|
redo logs/rollbacks/Data Separated |
|
Yes |
|
|
30 |
|
20 |
||
|
Disks used for rollback segments |
|
> 4 |
|
|
30 |
|
30 |
||
|
Disks used for temporary tablespaces |
> 2 |
|
|
30 |
|
30 |
|||
|
# of tables fragmented >5 extents |
|
10 or fewer |
|
20 |
|
0 |
|||
|
# of tables fragmented > 30extents |
|
2 or fewer |
|
20 |
|
0 |
|||
|
Disk Performance Index (DPI) |
|
Section Total |
|
250 |
|
130 |
|||
Education Performance Index (EPI)
The items of EPI are not related to system
performance directly. However,
a state of DBMS may be various depending on a person who manages it; how
often DBA tune it or how much DBA is trained.
The EPI score consists of 10 different items based on educational
levels of DBA and developers. Table
8 shows that some database developers caused the problems of DBMS.
Table 8. Education Performance Index (EPI) for a sample DBMS
|
Category Index |
|
|
|
Level
Required |
|
Maximum Score |
|||
|
DBAs required to tune database |
|
Yes |
|
|
30 |
|
30 |
||
|
Developers required to tune code written |
Yes |
|
|
30 |
|
30 |
|||
|
DBAs last trained in tuning |
|
|
Less than 1 year |
|
30 |
|
20 |
||
|
Developers last trained in tuning |
|
Less than 1 year |
|
30 |
|
0 |
|||
|
DBAs proficient in V$ views |
|
Yes |
|
|
30 |
|
30 |
||
|
DBAs proficient in Enterprise Manager |
Yes |
|
|
20 |
|
10 |
|||
|
DBAs trained in EXPLAIN PLAN |
|
Yes |
|
|
20 |
|
20 |
||
|
Developers trained in EXPLAIN PLAN |
|
Yes |
|
|
20 |
|
10 |
||
|
DBAs trained in use of hits |
|
|
Yes |
|
|
20 |
|
20 |
|
|
Developers trained in use of hints |
|
Yes |
|
|
20 |
|
10 |
||
|
Education Performance Index(EPI) |
Section Total |
|
250 |
|
180 |
||||
System Performance Index (SPI)
The last category of TPI is a system performance
index (SPI). It includes
backup and recovery test, external database review, data modeling, and
parallel processing. Table 9
has 9 items to compute a score of SPI.
Table 9. System Performance Index (SPI) for a sample DBMS
|
Category Index |
|
|
|
Level
Required |
|
Maximum Score |
|
||
|
Inside party database review |
|
< 1 year |
|
|
50 |
|
50 |
||
|
Ran UTLBSTAT/UTLESTAT last |
|
< 1 month |
|
30 |
|
10 |
|||
|
User asked about performance issues |
< 2 months |
|
30 |
|
30 |
||||
|
Backup tested for recovery speed |
|
Yes |
|
|
30 |
|
0 |
||
|
Outside party database review |
|
< 1 year |
|
|
30 |
|
0 |
||
|
Outside party operation system review |
< 1 year |
|
|
30 |
|
0 |
|||
|
Optimizer used |
|
|
|
Cost-based |
|
20 |
|
20 |
|
|
Strictly normalized/partially denormalized |
Denormalized |
|
20 |
|
0 |
||||
|
Parallel query used or tested for gains |
Yes |
|
|
10 |
|
10 |
|||
|
System performance Index(SPI) |
|
Section Total |
|
250 |
|
120 |
|||
Finally, we can compute a score of TPI by a sum of four categories. The sample DBMS mentioned in the above has 570 TPI points out of 1,000. In addition, we grade the overall performance as well as each category. As shown in Table 10, the sample DBMS is C, which means that the DBMS is placed on the top 40 percent of most systems in terms of the total performance.
Table 10. Total Performance Index (TPI) for a sample DBMS
|
Category Index |
|
|
|
Maximum
Score |
|
Score |
|
Grade |
|
|
Memory Performance Index (MPI) |
|
250 |
|
140 |
|
C |
|||
|
Disk Performance Index (DPI) |
|
250 |
|
130 |
|
C |
|||
|
Educational Performance Index (EPI) |
|
250 |
|
180 |
|
B |
|||
|
System Performance Index (SPI) |
|
250 |
|
120 |
|
C |
|||
|
|
|
|
|
|
1000 |
|
570 |
|
C |
The entire TPI tool is available on my personal DBA web site.
http://www.bridgeport.edu/~jelee/dba/TPI.xls.
Artifact D
SDM (Server and Database Monitoring) Tool
As a senior database administrator at IBM e-Business
hosting team, I needed a new tool to watch customer’s servers and DBMS.
Since the existing monitoring tools, such as Oracle OEM, IBM Tivoli
Monitoring, and BMC Patrol, are not very flexible with various IT
infrastructures, and limited in customization of their functions.
Therefore, I developed Server and Database Monitoring (SDM) tool
that supports any kinds of server and DBMS, and is very flexible in the
Internet environment. In
addition to monitoring service, SDM needs to detect and alarm abnormal
states of the systems, and generate periodic reports automatically.
What is SDM?
SDM is a web-based monitoring and reporting tool for
servers and databases in real-time. SDM
was developed by using ksh, awk and Perl5 for client side to collect the
meta-data, and gd library, zlib, rrdtool v1.0.28 and Perl5 for server side
to analyze them. Figure 2
shows the overall SDM architecture. As
shown in the figure, the meta-data are gathered from each server and DBMS
using a shell script. The
data are transferred into SDM server via FTP for the analysis.
Then, the output of analyzed data is served as two modes.
One is for an operator watching abnormal states that are not
identified by SDM server, and to generate regular reports.
The other is for a customer to check his/her own systems.
Both of them are served through web servers.
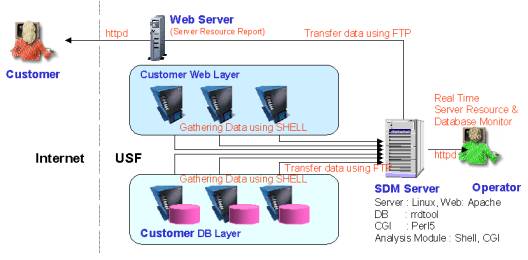
Figure 2. Architecture of Server and Database Monitoring (SDM) tool
Feature 1: Server Monitoring
-
Monitoring items: Load Average (run queue size), CPU Usage (% of user call, system call, wait and idle), Disk Usage (disk usage on each file system), I-Node Usage (I-node usage on each file system), Swap space Usage (swap space usage), Page out count (page out count), and Daemon Status (cron, inetd, syslogd, sysdog, esmd, dsmc process check).
-
Available OS: AIX, Solaris, and Windows 2000.
Feature 2: Database Monitoring
-
Monitoring items: databases UP/DOWN, SGA (total memory usage, buffer cache), Hit ratio (buffer, dictionary, library), Session (total count, active session, wait), Rollback wait, Tablespace (usage, fragmentation, allocation error), and Log check (alert_*.log).
-
Available DBMS: Oracle and DB2.
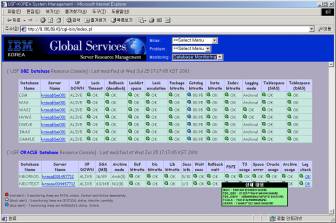
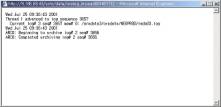
Figure 3. Screenshots of Database Monitoring Service
Feature 3: Server Resource Reporting
-
Report Type: Real-time ( daily, weekly, monthly, yearly), and Regular (Monthly Resource Report for each customer)
-
Report Items: CPU Activity, Free Memory, Virtual Memory, Page in VM, Run Queue Size, Total Disk Usage, Disk IO stat
-
Available OS: AIX, Solaris, and Windows 2000.
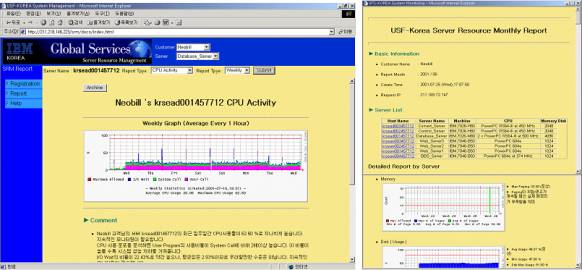
Figure 4. Screenshots of Server Resource Reporting Service
Feature 4: Problem Reporting
-
Daily Report: list of problems occurred since the last day
-
Weekly Report: list of problems occurred since the last week
-
Monthly Report: for problem analysis
-
Search Problem: problem searching by keyword
A SDM document and software are available on my personal DBA web site.
Document: http://www.bridgeport.edu/~jelee/dba/SDM.ppt
Software: http://www.bridgeport.edu/~jelee/dba/SDM.zipLast updated: 8/10/2006